Debugging
Ceres provides powerful debugging capabilities to help you troubleshoot your visual scripts.
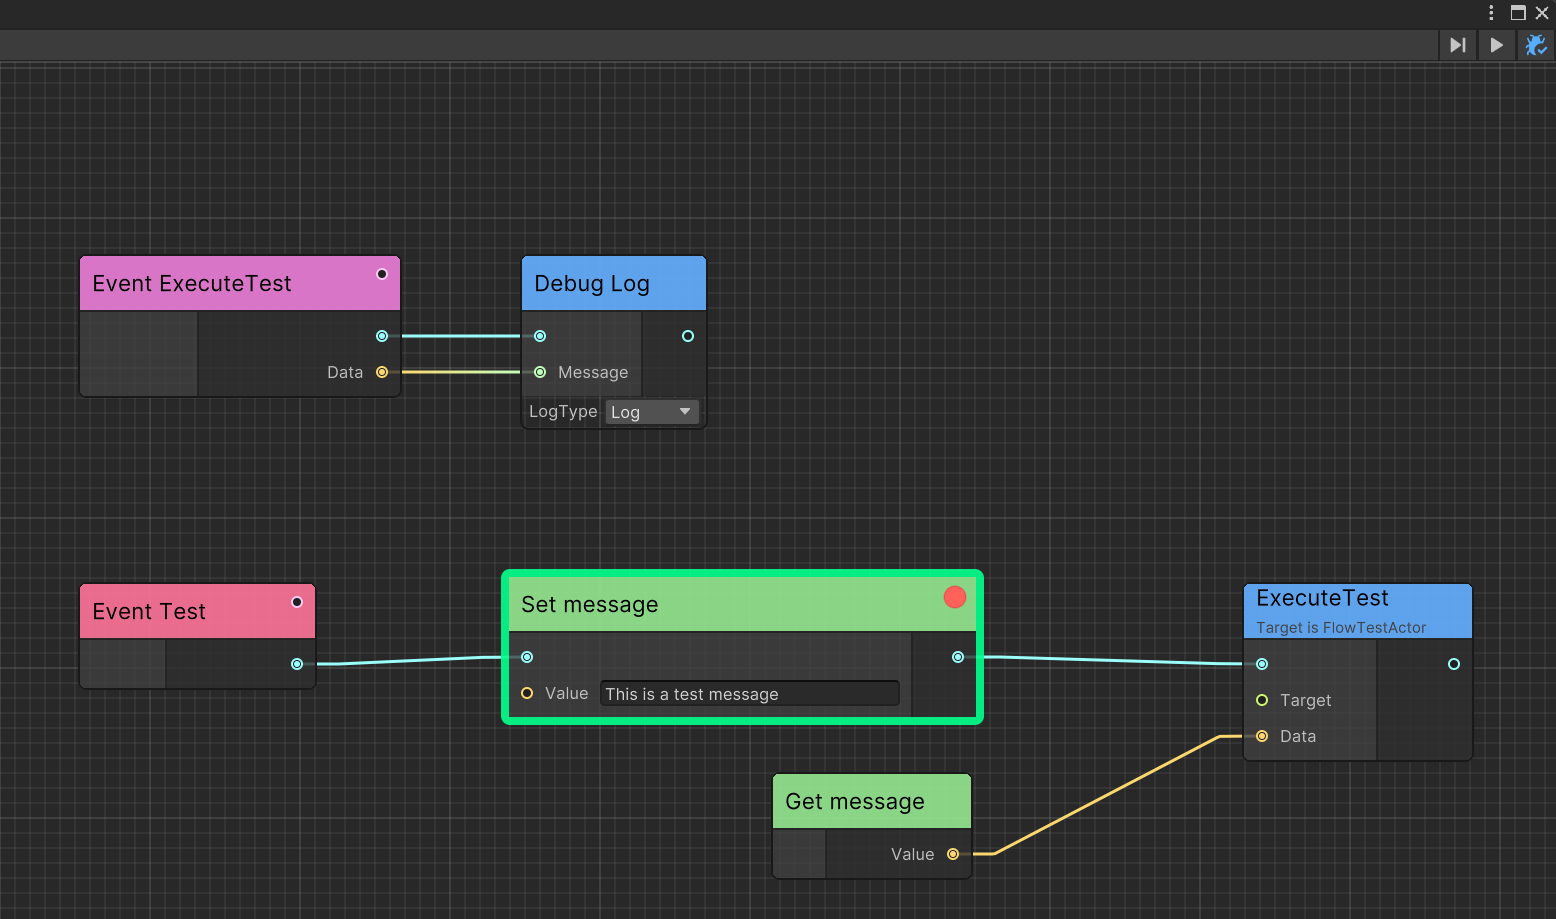
Enable Debug Mode
To enable and disable debug mode, click the debug button in the upper right corner. Then, you can click Next Frame to execute the graph node by node.
Breakpoints
You can right click any node and select Add Breakpoint, then click Next Breakpoint in the toolbar to execute the graph breakpoint by breakpoint.
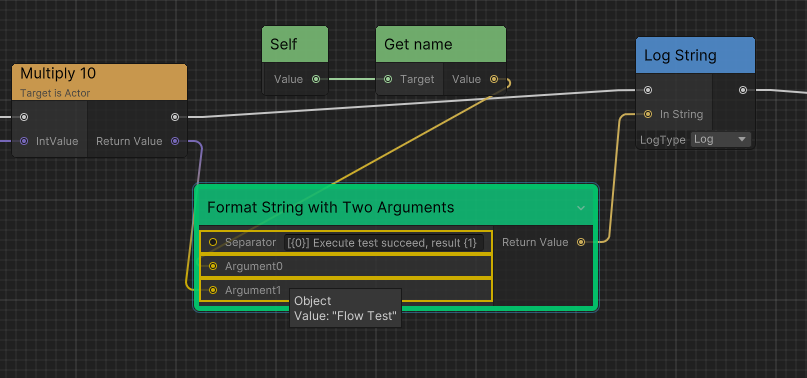
Port Debugging
Ceres editor can display the current value of an input port when the mouse hovers over the port of the node at the current breakpoint.
Graph Tracker
FlowGraphTracker is a class that can be used to track the execution of the graph for advanced debugging scenarios.
For more details, you can see the sample FlowGraphDependencyTracker.
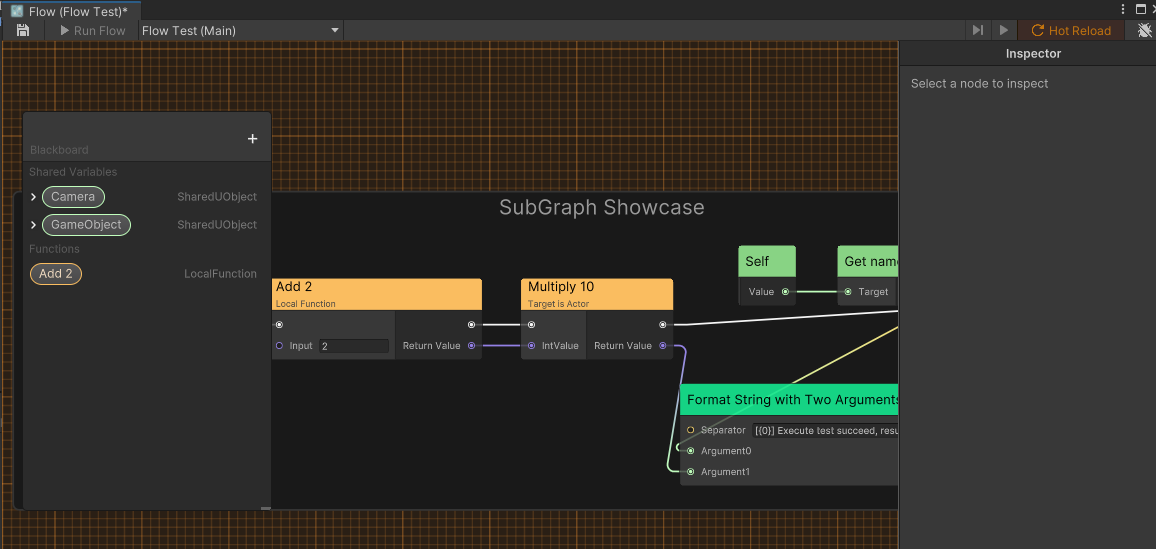
Hot Reload
Ceres supports hot reloading of FlowGraphObject. When you modify a FlowGraphObject in playing mode, the changes can be reflected immediately.
To enable hot reload, you need toggle the Hot Reload option in Flow Editor's toolbar and then try to save your graph in playing mode.
Next Steps
- Learn about Graph Tracker for advanced debugging and execution tracking
- Explore Custom Nodes to understand node execution flow
- Check Runtime Architecture for container types and execution context